Ferry vs flying: compare the real carbon footprint of your trip
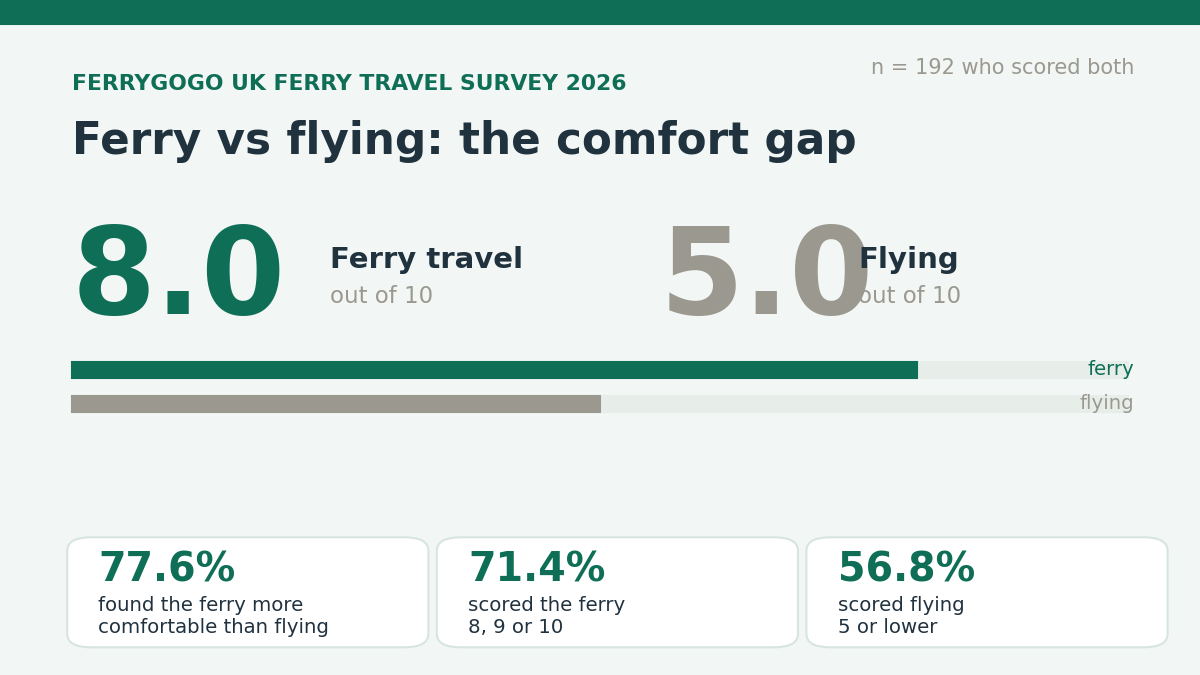
Back in 2022, our original ferry carbon footprint research compared ferries with flights, trains, cars, and other modes of travel. The basic conclusion was pretty clear: the ferry can be a much more conscious alternative to flying, especially when you travel as a foot passenger or share one car between several people.
But a real trip is never just one neat number. You do not magically appear at the ferry port, and you do not land at your final destination either. There is the drive to the port, the train to the harbour, the airport run, the onward miles after arrival: all those slightly boring bits that actually matter when you look at the full footprint.
So we built this calculator as a more practical follow-up to that research. Instead of only comparing the crossing with the flight, it looks at the whole journey: the miles to the port, the ferry route, the onward drive or train at the other end, and the equivalent flight with airport transfers included.
Pop your route in below and you will get an estimated footprint for both options in kg CO₂e. You will also see a per-person figure, where the ferry route's emissions actually come from, and a simple tree comparison to make the difference feel a bit less abstract.
Ferry vs flying: your trip's carbon footprint
The whole door-to-door journey, not just the crossing. Distances are in miles throughout.
How it works
This calculator compares the full door-to-door journey, not just the ferry crossing or the flight. Add your miles to the port, your ferry route, the onward journey after arrival and the equivalent flight with airport transfers. Enter your route below, and you will get an estimated carbon footprint in kg CO₂e for both options, including a per-person figure and a breakdown of where the ferry route's emissions come from, and how that compares to what trees absorb, to make it a bit more visual.
Your ferry journey
The flying comparison
Enter your trip to compare.
We compare the full door-to-door journey for both options.
About the numbers & disclaimer
Whole-journey approach. Ferry footprint = road to the port + the crossing + road after arrival. Flying footprint = the flight + road to and from the airports. That's why a short crossing with a long drive can still beat a flight, or lose to one.
Data sources. Figures use the UK Government's 2025 greenhouse gas conversion factors (DESNZ/Defra). Flights use the 2025 "average passenger" factors including radiative forcing (aviation's extra high-altitude warming effect) with an 8% distance uplift for indirect routing, as the official method recommends. Ferry figures use the 2025 sea-travel factors, and a car on board is counted once and shared across everyone travelling in it. Rail & sail (taking the train to and from the port) uses the 2025 national rail factor of about 0.035 kg CO₂e per passenger-km, counted per traveller. In rail & sail mode everyone is treated as a foot passenger, with no car on the ferry.
The everyday comparisons. The tree figure assumes a mature tree absorbs about 22 kg of CO₂ a year (a USDA Forest Service rule of thumb; real figures vary widely, roughly 10 to 40 kg, by species and age). The driving figure uses an average petrol car at about 0.16 kg CO₂e per km.
Please treat this as a planning estimate, not a certified figure. Real-world emissions shift with the ship and how full it is, freight, your vehicle, driving style, weather, the route taken and the electricity mix. Factors last reviewed: June 2026.
Ferry vs flying for popular trips from London
The figures below are per person for a return trip from London, using the same official 2025 data as the calculator above. The ferry column assumes two people sharing one petrol car for the whole door-to-door journey. Rail and sail assumes you travel as a foot passenger by train. The lowest option in each row is shown in bold.
| Destination | Rail & sail (kg) | Ferry + car, 2 sharing (kg) | Flying (kg) |
|---|
Two things drive these results. The more people share a car, the lower the per-person ferry figure becomes, so a couple or a family will see the ferry pull well ahead, while a solo driver heading somewhere distant may find flying lower. And rail and sail is the lowest-carbon option on almost every route, because the train carries far less per passenger than a car or a plane. For the longer trips, such as Barcelona, Oslo or Rome, remember that the ferry figure mostly reflects the long drive at the other end rather than the crossing itself.
What your result means
Treat the result as a solid planning estimate, not as a certified emissions report. Ferry emissions change with the vessel, how full it is, the weather, the freight on board, the route, the speed and the type of vehicle you bring with you. Flights vary too, depending on the aircraft, the routing, the load factor and the airport transfers at both ends.
That is why the door-to-door view matters so much. A short ferry crossing with a long drive attached can be less efficient than you might expect. On the other hand, a longer ferry route can still come out well if it replaces a flight and saves a lot of road miles. A foot passenger or rail and sail traveller will usually get a very different result from someone rolling onto the ferry in a campervan and driving for hours after arrival.
The best way to use the calculator is to test the trip you are actually considering. Try the ferry route with your car, then try it again as a foot passenger or rail and sail journey if that is realistic. You can also adjust the airport transfer miles to check whether the flight comparison still feels fair.
We are not trying to claim that the ferry always wins. Sometimes it will, sometimes it will not. The point is to make the comparison more honest. Once the full journey is included, you get a much clearer feel for where the emissions really sit, and whether the ferry is the better fit for the trip in front of you.
Where our data comes from
The emission factors in this calculator are based on the UK Government's 2025 greenhouse gas conversion factors, published by the Department for Energy Security and Net Zero (DESNZ) and often referred to as the Defra factors. These are the official figures many UK organisations use when reporting emissions, and they are updated each year.
For this calculator we use:
- Ferry: the 2025 sea travel factors for foot passengers and for passengers travelling with a car. A car on board is counted once and shared across everyone in it, so a family in one vehicle is not treated as several separate cars.
- Flights: the 2025 ‘average passenger' air travel factors, including radiative forcing (the extra warming effect of emissions released at high altitude). Flight distances include an 8% uplift for indirect routing and stacking, as recommended in the official method.
- Driving: the 2025 average car factors for petrol, diesel, hybrid and electric vehicles.
- Rail and sail: the 2025 national rail factor, applied per passenger.
The everyday comparisons are deliberately simple. The tree figure assumes that a mature tree absorbs roughly 22 kg of CO₂ a year, a USDA Forest Service rule of thumb that varies widely by species, age and location. The driving comparison uses an average petrol car at about 0.16 kg CO₂e per km. We review these assumptions when the official factors are updated.
Source: UK Government greenhouse gas reporting conversion factors 2025 (DESNZ), available at gov.uk.
Get our latest ferry guides, route updates and travel tips in your Google feed. Add FerryGoGo as a preferred source in Google, and follow us in Discover when Google shows the option.